Showing posts with label 3 Act. Show all posts

Monday, November 23, 2015

Should 3 Act Tasks Build Literacy?

I went to the Nashville NCTM Regional session by Graham Fletcher and Mike Wiernicki and they showed this slice of awesome:

You'll notice they covered up the text of a [K-5] word problem only to show the question at the bottom of the chart paper. I thought this was a really slick move to get students talking, thinking, and imagining. If you've been to one of my problem-solving sessions lately, you'll know I'm really encouraging math teachers to push student potential by creating a mystery, layering in the clues, and solving the mystery. Therefore, the slide Mike and Graham displayed really resonated with me. Imagine students taking those stickies off one at a time, creating suspense in the process. More importantly, in my opinion, a teacher can scaffold in the context and literacy demand of the word problem.

Imagine reading one sentence (or one part of a sentence) at a time on that chart paper, as a class or with a classmate, working on understanding the context better and better with each sticky that is removed. However, the resonation of their slide didn't stop there with me. It really got me asking myself, "Can we help students simultaneously build math skills and literacy skills with 3 Act tasks?"

As much as I love how 3 Act tasks make the math accessible to more students because the literacy demand is usually removed, I agree with teachers that voice their concern about this actual feature. Understandably, they're concerned about the literacy demand that many of our state tests demand. (*concern should not be limited to state tests)

Essentially, I'm wondering if there's a natural way to work in the literacy demand during Act 1 and Act 2 of a 3 Act task? For example, let's use my File Cabinet task as an example:

Students watch Act 1:


After we gather student thinking (noticing and wondering a la Math Forum) and have students make a guess, I'm feeling the notion to present students with the textual representation of this task at some point. I'm not sure when that point is, since I badly want to test this out with students. The text might look something like this:
Mr. Stadel is using sticky notes to completely cover a file cabinet in his classroom. How many sticky notes will he need to cover the five visible sides of the file cabinet?
Whether we (the teachers) present the text to students or students help compose the text description above, would this benefit both the math and literacy? Would it detract from the math?

Moving into Act 2:
I think it's still important to have students think of information (identify variables) that is important to know in solving this question. Lately, I've been encouraging teachers to have students formulate a plan without any data, numbers, measurements, or other information. Lately, I've been seeing students just grab the numbers from Act 2 and hastily plow into a wrong plan or formula, getting unreasonable answers. My suggestion: Let's sit tight on revealing the information in Act 2. Get students to formulate a plan or representation first. Maybe make a more precise estimate in the process. After going through that process, maybe we can refine our original text description to something like this that now includes the measurements necessary in solving the task:
Mr. Stadel is using 3" x 3" sticky notes to completely cover a file cabinet in his classroom. The file cabinet is a rectangular prism with a 36-inch width, 72-inch height, and an 18-inch depth. How many sticky notes will he need to cover the five visible sides of the file cabinet?
Now that we know more information in this task, I think the original text should be adjusted (updated) accordingly. To me this feels like we have removed all the stickies from the chart paper Mike and Graham gave us.

Similar to Act 1, I question if this would benefit both the math and literacy?

Since I am putting Act 1 and Act 2 under some scrutiny, it would only be fair to address Act 3 as well. Maybe the literacy in Act 3 seems more intuitive (all relative), but would this be a good time for students to write something that represents their plan from Act 2? For example:
We found the surface area of each side by... We figured that we could divide each side by 9 square inches, the area of one sticky. In doing so we predict Mr. Stadel will need X number of stickies to cover the file cabinet. 
There are two big reasons I was initially drawn to these tasks. 3 Act tasks typically:

  1. eliminate the literacy demand, making the math accessible to more students. 
  2. have Act 3 to validate (or break) the mathematical model we used in Act 2.

I still believe in 3 Act tasks, don't get me wrong. However, I believe we might be able to get even more out of them as teachers. I consider this: at what point do we say to our students,
Look, I first want you to access the mathematics without your english language skills (or lack thereof) getting in the way. We have to keep in mind that our state tests (and other math problems) require strong literacy skills. I think you need to see what this task might look like as just plain text.
Or do we say this at all to students? parents? colleagues? administrators?

Many online colleagues gave input on building literacy into an Act 4. You can read more in the thread here. I support extended opportunities for more literacy like our colleagues suggest (or practice). However, my focus is during Act 1 and Act 2 right now. Help me think this through. Add some thoughts in the comments.

Literacy,
1020


Wednesday, July 1, 2015

Tacos For (almost) Everyone

Do you remember when I blogged about the Ultimate Task for Vertical Planning: Stacking Cups? If not, feel free to check it out at your convenience. I've got another task for you that can be used at multiple grade levels: Dan Meyer's Taco Cart.

When asking:
Who will reach the taco cart first?
there are so many mathematical opportunities awaiting us. Here are a few:

Math 6 (maybe Math 7)
Pass out this handout during Act 2 and tell students you will only give them one dimension. Choose wisely.
Read more about this great technique on Fawn's blog post about Mr. Meyer's Taco Cart.
It simply is brilliant. Students are measuring the dimensions (distances) on the paper and using proportional reasoning to figure out the real life distances. I recommend students use centimeters when measuring the dimensions of the triangle on the handout. I really enjoy this technique.

Math 8
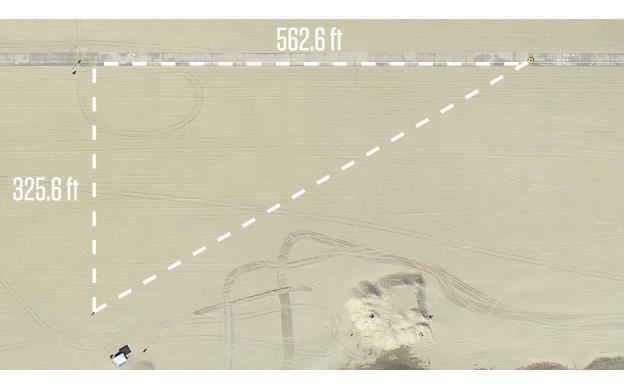
If you're a math teacher and you see the picture Dan provided for Act 2, your intuition will most likely steer you in the direction of the Pythagorean Theorem. Go for it!
Geometry (HS)
Let's say you have already used Taco Cart during the year to apply the Pythagorean Theorem or Distance Formula (Desmos). How about we extend the mathematics and look for more right triangle relationships in Taco Cart. I noticed that the hypotenuse is about twice the length of the shorter leg. Let me connect that to the context of the story: Ben's distance is about twice the distance Dan travels in sand. That's right, Dan gave us a 30-60-90 right triangle. Pro skills there, Dan.
*I'm not saying the 30-60-90 relationship is the most intuitive, but we'd be helping students make connections with previous learning. 

Algebra and Beyond
As you move into the sequels provided on the website, there's a lot of higher level math. Depending on the question, the problem-solving is fun. I worked with a high school group of math teachers who found it extremely challenging to solve the question:
What path to the taco cart would take the least amount of time?
Overall, this is such a fun and meaningful task. Dan has given us a treat! Today, my students did such a great job arguing, sharing theories, identifying variables, and using their intuition even before I unveiled any information from Act 2. It was awesome! I'm avoiding the use of the Pythagorean Theorem this round. I went Fawn-style by giving students only one dimension on their Act 2 handout. So good!

Tacos por favor,
942

Saturday, June 13, 2015

Should We Use the Term "pace" More?

I'm preparing to be one of the presenters at a 3-day NCTM Deep Dive Institute in July. Hope you can make it. Fawn will be presenting too.

I've come across some great tasks from NCTM, thanks to Peg Cagle (that's C-A-G-L-E everyone) that I've adapted to have a much lower entry point for teachers and students. However, I'm also looking to mix in some favorite Estimation 180 challenges and 3 Acts like Fast Clapper from Nathan.


I really dig this task. At first glance though, it looks pretty straightforward. Act 2 could look as simple as showing students a screenshot like this:
Then tell students to use this ratio to predict how many claps this dude will complete in a minute. We could call it a day, but what fun would that be?

Here's what I think should precede any screenshot from the Act 1 video. Have students get out their cell phones and partner up. Record their partner clapping for various increments that are less than 30 seconds. For example: 0, 5, 6, 10, 12, 15, 20, etc. Keep track of it in a table...
Then see who is the fastest clapper in the class and if they can break the record. Talk about what might prevent the students or dude in the video from breaking the record.

Here's an additional place I'd like to take Act 2. Talk about the term "pace". I really like this question I'll be using from now on with students and teachers:
How often should we check to see if he is on pace to break the record?
I think this question opens up the mathematics, especially for a table of equivalent ratios and double number lines. Forget equations (proportions) here. Furthermore, it reminds me of the pace timers that you sometimes see on television during the Olympics.

Talking about the word pace, is this the same thing as rate...?
I'd really love to hear from you about the term "pace".
  • How often do you use the word pace in math class?
  • What context do you use the word pace?
  • Are terms like rate or slope synonyms to pace?
  • Tell me everything you know about pace or how you use pace in your class?
Seriously, I want to know. Teach me!

Pace yourself,
312

Sunday, May 3, 2015

The Ultimate Task for Vertical Planning: Stacking Cups

This past week, I submitted a speaker proposal for NCTM 2016 in San Fransisco. The proposal is for a Grade 6-8 Burst (30 minutes) with the exact same title as this blog post: The Ultimate Task for Vertical Planning: Stacking Cups. I figure if I don't get accepted, at least I can share my thoughts here and you all can help spread the word about my idea if you think it has potential. If it does get accepted, I look forward to giving an update a year from now at NCTM. Here's my session description:
Who says you can't use the same task each year? Come see why Stacking Cups might be the single best secondary math task to get teachers at your school, district, or state to see the importance and necessity of vertical planning. Use tasks that utilize connections from the previous year and extend the mathematics each year. Work smarter, not harder. 
Let's first back up a bit. I attended Alex Overwijk's session at NCTM Boston a few weeks back. I had already read his awesome blog post "Open Strategy Cup Stacking" and knew there are multiple teaching moments with Stacking Cups. I remember teaching Math 8 a few years ago and getting a lot of use out of Stacking Cups as you can see a couple times here and here. I was preparing for a training with math teachers from grades 6-12 and THAT's when it hit me: I could have a room full of math teachers from grades six through twelve and they all could:
  • be working on this task
  • see the different skills and tools necessary for solving
  • know the expectation of each grade level
I've heard comments from teachers numerous times like, 
"Well, if they do File Cabinet in 6th grade, I can't do it in 7th grade with my students."
"If they've done Stacking Cups in Math 8, then I can't do it in Algebra."
"If the 5th grade teachers use Estimation 180 with students, then I can't." 
YES! YOU CAN! It's called vertical planning.

YES, YOU CAN! Instead, let's ask different questions like, "How can we use the same task to extend the mathematics each year?" and  "How can we make connections to prior learning from the previous grade level?"

Let's work smarter, not harder.

I will spend the rest of this blog post highlighting each grade level and suggested uses for Stacking Cups. It won't be complete or the final version as this is through the lens of one person. I'm confident, with your help and critique, we can make it even better.
Math 6
Question: How many cups do we need to stack (alternating) to reach someone's height?
We talk about rate. We organize our information on a number line, in a table, using a tape diagram, etc. We explore the rates using various models.

Math 7
Question 1: How many cups do we need to stack (alternating) to reach someone's height?
We continue the conversation started in Math 6 revolving around rates, using constant of proportionality. All of this can be represented in a table, as an equation, and in a coordinate plane.

Question 2: How many cups do we need to stack (consecutively) to reach someone's height?
We now shift our thinking a bit where there is still a constant increase with each cup, but there is an initial amount (the cup handle). Students explore how to write an equation to represent this situation and solve it.

Question 3What would be possible dimensions of a box that would contain the cups to stack to someone's heightWhich dimensions would be the most cost effective?
Imagine students understanding surface area and volume and how they're related to each other, especially if we model with mathematics, by identifying variables such as:
  • cardboard cost
  • delivery truck capacity 
  • store storage sizes
  • consumer trends with buying cups
  • more

Math 8
Question 1: How many cups do we need to stack (consecutively) to reach someone's height?
Similar to question 2 in Math 7. However, we extend the mathematical understanding as we explore constant rate of change (slope), input and output, linear, and how our situation can be represented in the form y = mx + b.

Question 2: When will two stacks of different sized cups be equal in height and have the same number of cups in each stack?
We introduce students to linear systems using this task. Students can organize the information about each cup in a table. We can extend prior knowledge to represent the situation using graphs, equations, and functions.
*By the end of Math 8, it might be helpful to mention (at least informally) to students the significance of discrete functions.

Algebra
We tighten up the math (both questions) previously learned in Math 8. How can we extend the mathematics. Add more challenging situations like the stacks start on different objects like desks, boxes, etc.
Question 3: How many cups would we need to stack in a triangular formation to someone's height?
This questions really extends the mathematics for students, but we can still use the tools they've learned from previous grades. Maybe students start by organizing the data in a table. Maybe they graph the data and notice it isn't linear. Maybe we can use desmos with sliders or a line of regression to explore quadratics.

Beyond Algebra and Geometry:
I'll admit this is where I'm a little rusty and would need you high school pros to jump in and contribute. I think with the triangle stacking, it can be taken from quadratic to a divergent series. I've also seen high school teachers come up with the following representations:

Al Overwijk also stacked cups in a triangular pyramid which is awesome.

Let's keep this vertical planning going. If you would like a couple charges, here you go:
Go to your site and/or district and push for Stacking Cups to be a signature task at all sites and secondary grade levels. Help support your colleagues with vertical planning. Report back.
Look for other tasks out there like Robert Kaplinsky's Hot Dogs or Dan Meyer's Penny Circle or Mathalicious' Wheel of Fortune or Graham Fletcher's Water Boy that can be used with vertical planning. Report back.
Vertical,
432


Sunday, March 8, 2015

A Jammed Rational-Irrational War, Stacking Cups Week

Some cool stuff happened this week. Well at least I think it was cool.

Monday
One of my math fellows was observed by other math teachers from our district. He was starting a new unit with rational and irrational numbers, focusing on 8.NS.1 and 2. I might be wrong, but pretty dry stuff… here’s how we spiced it up a little.

We did a pre-assessment using the Post-It Plus app. Yes, my obsession with Post-It notes has gone to a new level: digital. We created a file within the app, posted it on his Haiku calendar, and had the students download the file into their app on their iPad. 

Students first worked individually to sort the terms from least to greatest for a few minutes. Since his students are grouped in fours, they then narrowed it down to one iPad screen they thought was most accurate. (Quick demo)

*Reflection: we should have had students paired up first, discuss, and narrow it down to two screens for the entire group. Next, the whole group of four students would discuss and narrow the two iPad screens down to one screen for the group.

Once each group settled on a screen they felt most confident with, they took a screenshot and uploaded their group’s screenshot to the Padlet page my fellow created for them.

My fellow used this Padlet page to assess the overall climate of the class (without teaching them a single thing). He used this real-time data to have some really rich conversations and share-out of ideas from students.

Remember to tell students:
  • It’s okay if you’re wrong. 
  • Make your best guess.
  • I just want to see what you already might know.
Flash forward to Friday:
The previous weekend I asked the same fellow what he thought about playing War with rational and irrational terms. Side note: I play a few card games with my young son and one of them is War. My fellow thought the idea was epic. He ran with it. Here how he made it awesome:
  • He made these awesome cards.
    • Some values had multiple representations
  • Printed them out on card stock.
  • Made a graphic organizer for students.
  • Each group of four was broken down like this:
    • 2 people played War while the other 2 people recorded and were the judges.
    • The next round, the roles were switched.
  • There were 3 rounds.
  • Each round was 6-10 minutes
  • He stopped class and made a spectacle whenever two students were at war.
  • The third and final round was between the winners of the first two rounds.
I asked if I had his permission to share the cards and he said, “Sure.”

Tuesday:
Another fellow asked me to model Stacking Cups in their first period class, which ran less than 45 minutes. My fellow requested I complete the task with students in one period. I explained that I’ve never “finished” the task in one period because there is so much to explore and learn in the task. I respected the request and  tried to cram it into one period. I spent too much time launching the task. 

Act 2 (the best part) felt rushed and we still didn't finish. My fellow and I debriefed and made some adjustments so she could finish it with her next period. She stuck to the adjustments and did a fantastic job facilitating the task. The students were doing awesome and amazing math during Act 2… and what do you know? The class was over. I love that my fellow was going to revisit the task the next day. Could we have spent another day on the task? Yes. It’s a starting point and I’m very proud of my fellow for trying out something new and doing a great job. I’d say the sweet spot would be one-and-a-half days for this task...
*Side note: I encourage you do styrofoam cups earlier in the year, and use Stacking Cups throughout the entire linear systems unit.

Thursday:
Another teacher wanted me to model Stacking Cups as well. When we sat down to plan, she was totally cool with spending one-and-a-half days on the task. Great news!
I launched the task, used a Padlet page to capture what they noticed. I asked the question, "Where will they tie?" and used a Google form to collect their guesses (see my post on using Google forms to collect student thinking). 

We gave each group only 4 white styrofoam cups. Students were making tables, or writing equations, or some were even wanting to graph their equations. Interesting note: some students started their table with zero cups having a height of 9.2 centimeters. The teacher had only taught graphing systems, so students were already thinking ahead to substitution. It was awesome. She did a wonderful job facilitating her first 3-Act task. We didn’t finish the task in one period, but it felt right knowing we had another half-day to wrap up the task. 

Back to Friday:
After work, I started putting the meat in my upcoming session, Math Mistakes and Error Analysis: Diamonds in the Rough. Although I will be showcasing a couple ways I’ve had success with error analysis with students, I love that I’ll be showcasing some awesome work and contributions from:
Hope to see you in my upcoming session as we explore why error analysis is important to:
  • help drive instruction
  • curb student misconceptions and
  • strengthen formative assessment. 


Hope your week went well too. If not, hope this week is better.

Rational/Irrational,
516


Wednesday, July 30, 2014

San Diego Conversions

I was in San Diego, California the past few days doing the whole San Diego Zoo and SeaWorld thing with the family. We had a great time, but that's not the point of the post. There were definitely a handful of opportunities to capture some math moments, but I've found it more important to contain myself (mathematically) when I'm with family and make the most of our time together. Here are the two things I captured and want to share.

Number 1: 
We were waiting to board the Wild Arctic Ride (virtual helicopter ride) at SeaWorld and watched this video. There were subtitles in Spanish for our spanish-speaking (reading) friends. However, they go along with the helicopter pilot.

Here's Act 1:

When I saw the the number behind the black box, I thought, "Is that right? Is 400 miles per hour really ### kilometers per hour?"
Are they correctly converting for our Spanish speaking friends? It turns out that 400 miles per hour is about 643.7 kilometers per hour.

Here's act 3:

What do you think? Should I keep the black box there? Should I delete it?
I feel this is one of those moments where I don't insert a black box and we simply ask students:
Is 400 miles per hour really 600 kilometers per hour?
I'm curious about students arguing about this one? or would they even care?
What difference would 40 kilometers per hour make?
Where do you stand, on any of it?

Number 2: 
The great thing about San Diego is there are tons of people from many different places of the world. San Diego has an international airport and many places of interest besides SeaWorld and the zoo to contribute to this melting pot. I loved listening to all the different languages being spoken throughout the day. Therefore, it didn't surprise me when I walked into the pool area for the first time on our trip and noticed a few interesting things. I couldn't help but think how wonderful it would be to use these in any math classroom, specifically Math 6. The first thing you see as you enter the pool area is the jacuzzi. I couldn't help but notice the depth:
Okay class, check this conversion. It ends up making sense and I appreciate the use of meters for pretty much everyone outside of the United States. Seriously, I simply have such a hard time understanding why the United States uses inches, feet, yards, miles, etc. I digress.

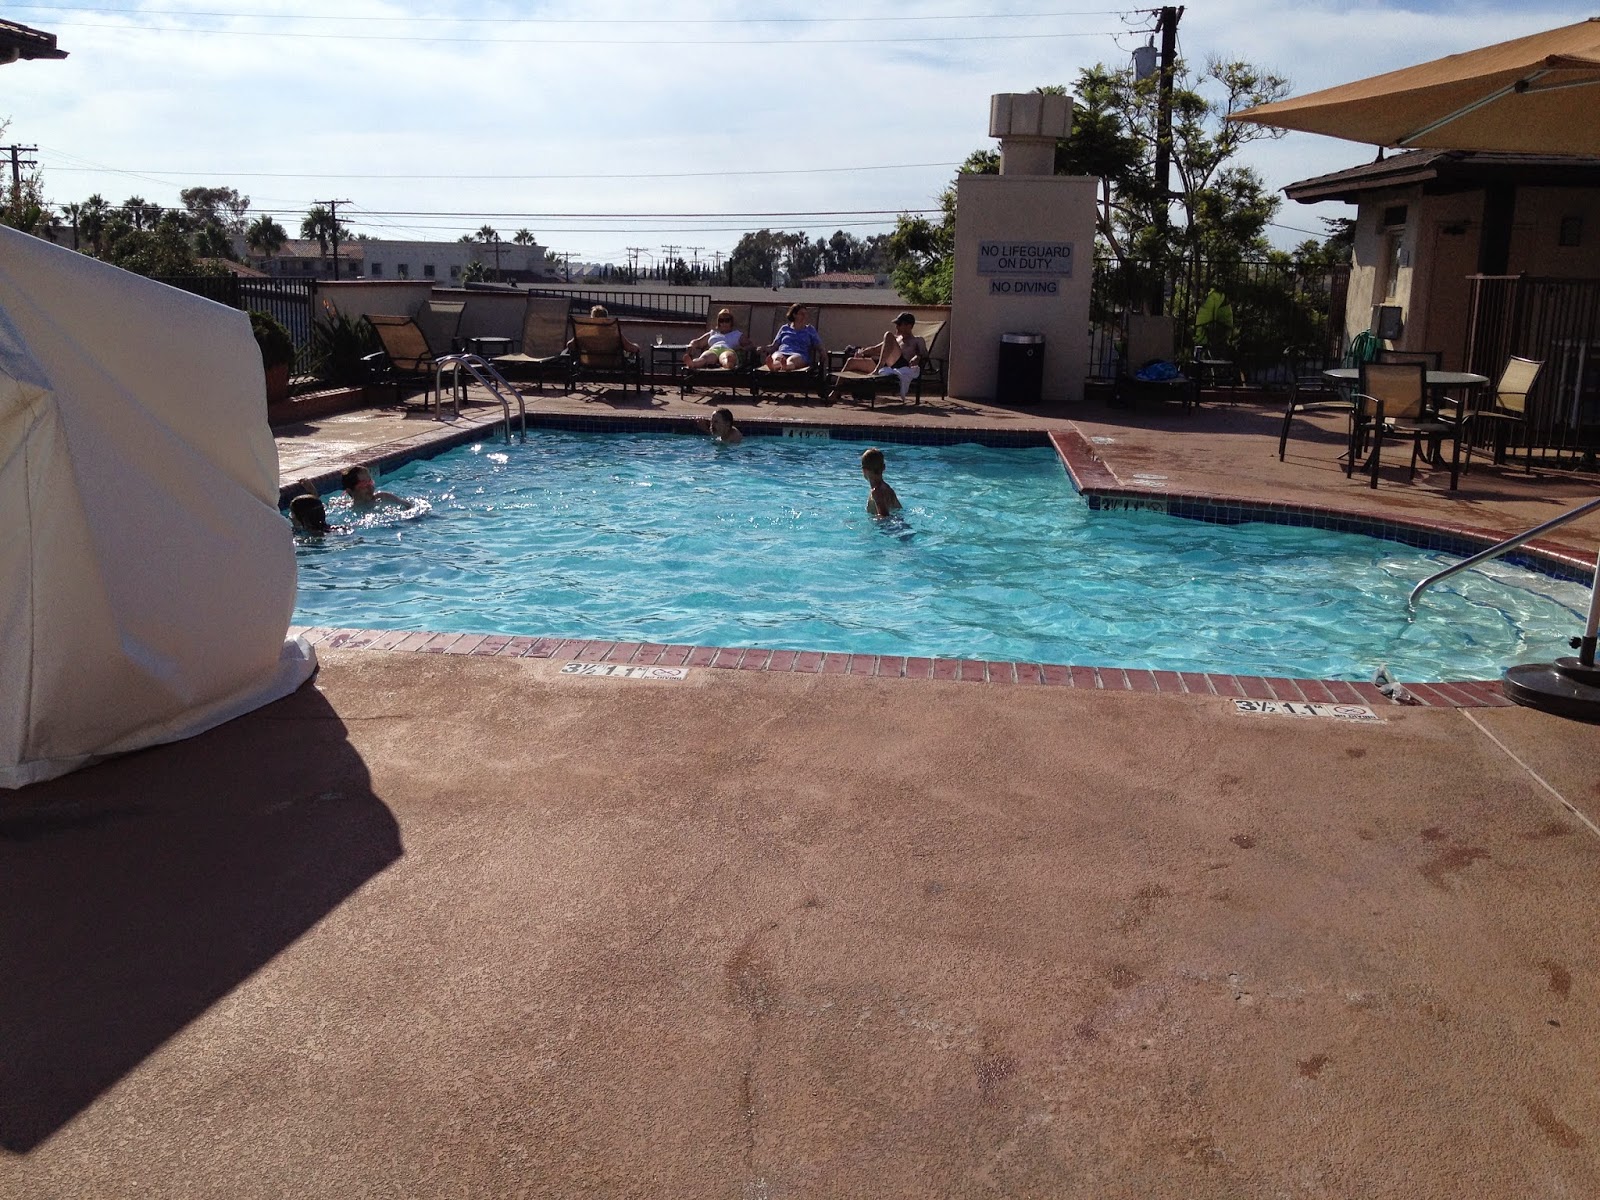
Here's the (very shallow) pool:
Let's look a little closer at the depth signs around the pool. The deepest part of the pool is 4 feet or 1.2 meters. Okay class, check this conversion. Looks pretty legit, right?
So, if you saw a depth sign with 3.5 feet, what would you put the meters conversion at? How would you order these pictures with your students? Which would you present first? second? third? or would you give them all to your students at the same time? Would you cover up one of the measurements (like feet) and only show them one measurement so they work on finding the conversion. Here's the 3.5 ft depth sign.

Okay, if you do the conversion, 3.5 feet is 1.0668 meters. Obviously, someone was following their rounding rules. A few questions pop into mind here:
Should we round up?
Would it be wiser to round to 1 meter?
How much of a difference does roughly 4 centimeters make?
Could they not use a slightly larger tile and put 1.07 meters?
These questions aren't the only questions, nor the most profound, but I'm still curious.

There's one more crazy thing about this pool I had to capture and share. How did they get away with this? 
Look closely. Inside the pool is a depth of 4 feet (1.1 meters). Outside the pool is a depth of 3.5 feet (1.1 meters). WHAT?!!! Now reflecting, I should have had my wife take a picture of me next to the sign to get the water level and measure how deep it actually is here. I don't know about you, but 6 inches is definitely more significant than the 4 centimeters we discussed earlier.
At what point does an error like this matter significantly enough to change it? 6 inches? 2 inches? 12 inches? and in what direction: shallower or deeper?

How would you use any of these images or video in your class to help facilitate discussions or arguments regarding conversions?

SD conversions,
906

Sunday, June 15, 2014

A Few Updates

Update 1:
I finally finished Act 3 for my Deodorant lesson. I hope you check it out and can give me some feedback; I think it could be much better with your help. If nothing else, check out how long it took to use 5 sticks of deodorant. Mathematical Modeling should really be at the forefront of this task. It might appear linear, but I would bet a year's supply of deodorant that an adolescent's deodorant use will be far different than mine. I also guarantee students will think of variables ranging from climate to age to geographical location to genetics to more. I think you'll have some excellent conversations with the deodorant task. My favorite part is the sequel: How many sticks of deodorant would one use in a lifetime?

Way back when this task first started, I opened up a little estimation competition in the comments at 101qs. Don't listen to a word Nathan Kraft says. The person with the closest guess would win an Estimation 180 prize. With so many close estimates, the following gentlemen will be the first to receive the new Estimation 180 stickers, hot off the press!

Congratulations to:
1st place: Chris Robinson (May 14, 2014)
2nd place: Robert Kaplinsky (May 5, 2014)
2nd place: Michael Fenton (May 15, 2014)
3rd place: James Cleveland (May 3, 2014)

Update 2:
Estimation 180 will be getting a facelift and other updates over the summer. Here are a few things to look out for:
  • New logo
  • New fields for entering student estimates
  • Clean spreadsheets containing "other estimates"
  • Updated Lessons
  • Search by Categories
  • Sentence frames for student reasoning
I'm most excited about the last update; sentence frames. I occasionally browse over student responses and notice many students entered "I guessed." I think it would be extremely helpful for teachers to provide their students with sentence frames in order to better articulate their reasoning. I will be focusing on this tool in upcoming presentations and workshops.

The new logo was done by my niece. I love her simple design, the two 180 degree arrows, the metric reference, and her idea to transform me into a stick man. That reminds me, I still owe her a pizza!

I hope to get a few t-shirts made too. You can sport them at your next PLC, department meeting, casual Friday, or math conference. Any takers?

Update 3:
I've accepted a Teacher On Special Assignment (TOSA) position with my district for next year. It's a bittersweet feeling at this point. On one hand, I'm very excited because I'll be working at various secondary sites throughout my district, collaborating with other math teachers, helping design lessons and implementing various technology. My official title will be a Digital Learning Coach. I hope to seek advice from people like John Stevens, who have been doing this for some time now. As I pack up my room, I already miss my own classroom and students. However, I look forward to learning a great deal from the teachers I will be fortunate to work with and the students I'll be able to interact with at each site.

Updates,
243

Saturday, April 26, 2014

SBAC on Steroids?

California is an SBAC (Smarter Balanced Assessment Consortium) state. This last week my school started the SBAC Field Tests and I was a Test Administrator for my 7th grade classes. Before I continue, let me post part of the Security Affidavit I had to sign.

That's right, I will not divulge the contents of the field test. However, I will first refer you to last year's post where I made a video comparing released CST questions and SBAC practice questions.  Here's a reminder (screen shot), comparing just two questions. 

This week, I felt like my students were looking at SBAC practice questions that were on steroids. Since I can't speak about the SBAC Field Test questions, I took my Deodorant 3 Act task and put what I think the SBAC steroid version might look like. I have nothing against SBAC. I tried to create a similar task that had rigor, complexity, and mathematical modeling.

First, my Deodorant task goes like this:
Act 1: How long will it take to use all of that deodorant?

Act 2: Data from the first 4 sticks. 

Act 3: The answer is still in the works. 

Sequel: How many sticks of deodorant would a person use in one lifetime?

Here's how I'd see this same task presented SBAC-on-steroids-style. 

I walked away this week, thinking our students need to do many things.
  1. Read the story. 
  2. Decode the text.
  3. Understand the question.
  4. Organize the data.
  5. Retrieve and access the correct skill(s) or skill set.
  6. Apply the necessary skills.
  7. Perform the correct operations with the above skills.
  8. Interpret their answer.
  9. Explain (and articulate) their answer.
As a teacher of many ELD students, I can safely say that the following steps are already challenging; 1, 2, 3, 8, and 9. Don't get me wrong. I believe in literacy, but I wouldn't want language to be a barrier when assessing a student's mathematical abilities.

Hear this though: Students must make sense of the problem before they can use mathematical modeling to predict the answer. Then, they must articulate how they got their answer. I would consider this expectation the new norm.

I'm not done. I could totally see SBAC taking this deodorant task and creating an additional question that would complete my 3 Act. Check out this doozy.

We're looking for students to drag numbers to both axes, use a line of best fit, make a mathematical prediction, and explain everything again. The only thing I left out of this question was for students to write an equation for the line they draw. 

I have more to say about this, but that's enough for now. I'm already thinking about how to better prepare my students for these types of questions, which should be my next post. If you have any thoughts, please share. If you've made it this far, here's a preview of Act 3 for my deodorant task. Don't worry, I keep my shirt on!


Steroids,
1158

Monday, February 10, 2014

Explain that, please.

Recently, I've given a few teacher workshops/conferences and have had the luxury of reflecting on teacher moves as I facilitate a lesson with the attendees. One of the many things we talk about are teacher responses to students.
Me: Did anyone hear me say, "No. That's wrong. You're wrong. I don't like your answer."
Attendees: No.
Me: Right. Instead, you'll hear me say things like, "Can you explain what you did here? Explain that, please. I noticed you did [this] here, please share how you got [that]. I'm curious how you came up with that. Walk me through what you did."  
I tell teachers that I'm taking the emphasis away from right versus wrong answers and placing an interest on the student's thought process and problem-solving. I continue with teachers:
Me: By telling a student they're wrong, a student can have the tendency to shutdown [I make the sound effect of a machine shutting down, "BOOOOvvvvvvvv"]. By asking a student to explain things, it shows that I'm more interested in how they arrived at their answer. 
As teachers, we know a student can be told they're wrong and it's easy for them to give up. On the flip side, when we validate a kid by telling them they're right, the student can also shut down and never reach the higher levels of Depth of Knowledge.

Recently, a workshop attendee asked me how I respond to students who have nailed the answer to a 3 Act task. First, I have them explain their problem-solving plan to me. Second, I question any details that were unclear, encourage them to be more precise, or have them explain their units of measurement. Third, I ask them if they feel confident in their answer after explaining it to me. Fourth, I validate them by simply saying, "That makes sense to me."

I don't tell them they're correct. I treat them just like as if they got the answer wrong. If that doesn't satisfy them, I respond with, "We'll find out soon if you're correct, but that (their explanation and work) makes sense to me." At this point, I offer them an extension to the task. I'd like to talk more about this later, but usually the extension revolves around the students creating something with the new knowledge or skills they have just recently gained.

After all that, please add your favorite lines when questioning students to this Google doc. I think it's also helpful we create a list of lines we avoid using with students as they explore math.

Here are a few people with other stellar teacher moves/lines to support students.
Max Ray: 26 Questions You Can Ask Instead
Dan Meyer: You Don't Have To Be The Answer Key
David Cox: Creating A Culture Of Questions
Steve Leinwand: Accessible Mathematics

BOOOOvvvvvvvv,
645

Tuesday, January 28, 2014

Estimation 180 has Lessons!

Head over to Estimation 180 and you'll see this lovely new option in the menu bar.

LESSONS!

That's right! 

LESSONS!

I've added a "Lessons" page with many lessons I've created, sorting them by their CCSS. I'd like to thank Dan Meyer and Robert Kaplinsky for their friendly suggestions (nudging) to tag my lessons in an attempt to make it easier for other teachers to find and use. Plus, I'm tired of my lessons collecting digital dust and hope that teachers can find and use them.

I was honored to give a workshop for teachers in my district today. The workshop became the motivating factor for making this Lessons page. Right now, most of the lessons are 3 Act lessons that can be found at Dan's 101qs.com A few other lessons are ones I've blogged about. However, I have added two test pages at Estimation 180 where the entire lesson is available for teachers to use. Right now. At Estimation 180.

Pay close attention to my File Cabinet and Stacking Cups lesson PAGES!.

These two full-on lessons are ready for you and your students. You'll see all three acts, teacher notes, student work, student handout (if you like/need), and downloadable videos. Let me know if you have any thoughts, advice, or questions.


I hope this "Lessons" page is useful and/or better than that silly unorganized spreadsheet I've got lingering. You'll notice a few links are under construction, but many links deliver the goods. Check in often for updates.

LESSONS!
1023

P.S. Thanks to Fawn, Nathan, Robert, and Eric for your feedback.

Thursday, January 16, 2014

Your Eyes Are Amazing

This Centrum television commercial caught my ear for a few reasons. I tracked it down on the Internet tonight and edited it for Act 1. You can find the entire lesson here at 101qs.com. It's a quick little lesson for Math 6 (6.RP.3d).

Act 1:

Question: How many football fields is 10 miles?

Act 2:
I'm not giving much information for Act 2 as I'm leaving this part of the mathematical modeling process up to the teachers and the students (mainly students). I think there's an essential part to the classroom discussion and I hint at it with the following questions (if necessary) left in the teacher notes:

  • Ask students, "What information would be helpful here?"
  • Ask students, "How are football fields measured and with what unit of measurement?"
  • Allow your students to decide the length of a football field.

I'd like you to do the math right now. Go ahead. I'll wait. It won't take you long.

10 miles. How many football fields is that?

Act 3:

Wait!
Timeout!
Is this commercial's math wrong???

Should it be 176 football fields or 146 football fields?

What did you use as your football field length? Did you use 100 yards? Did you account for the end-zones being 10 yards each, making the total length of the football field 120 yards?

On a related note, I'm a little surprised the Centrum didn't use 100 yards so they could claim 176 football fields for a more dramatical pitch in their commercial. I also think it's fun to talk about what it would take for human eyes to actually see that candle 10 miles away. Darkety-dark-dark probably. No light pollution. No obstructions. Maybe a desert? No bright moon (which the commercial includes for some weird reason).

I'll be using this with my sixth graders this year when we get to conversions. It's a fun little task. Let me know if you have anything to add.

Candle Eyes,
1059

Monday, July 15, 2013

Snail's Pace

Last post, I shared a lesson (Woody's Raise) that included both Act 1 and Act 3. I asked you all to collaborate and design Act 2. Many of you came through like champs in the comments.
THANK YOU!

For this post, I only have an Act 1, leaving Act 2 even more open-ended. I'll admit, I only have Act 1 because I haven't invested the time necessary for Act 2 and Act 3. Here's my current Act 1.

I thought of this lesson many months ago while out walking in the morning, but wanted to capture it on video... no joke. So until that time actually comes along, I'll give you what I envisioned for Act 1, the video version. We start with Bill Conti's Gonna Fly Now (Theme from Rocky) as we take a couple close-up shots of the snail. The camera pans out to a bird's eye view of the snail starting at one side of the sidewalk, letting time elapse for about 15-20 seconds.

Back to the picture of the snail who has an increasingly long road ahead of him. I notice that he isn't taking the shortest path to the other side. I notice that there aren't any other snails to avoid. I notice the sidewalk is wet. I wonder what his path will be. Will his path be linear? curved? circular? other? I wonder what his rate will be. I wonder what the dimensions of the sidewalk are. I wonder if the Pythagorean Theorem could be used here. What do you wonder?

Head over to Dan Meyer's 101qs.com and enter a question (or skip it) so you can see my Teacher Notes for Act 2. You might need to log in. Thanks to Ignacio Mancera for linking a site with Speed of Animals. This will help assist our Act 2 adventure.

Here's what I have so far if you can't get into 101qs.

What initial conversation(s) would you have with students?
How would you have students work with Act 2 information (dimensions, rate of snail)?
Is this a waste of time?
Should we (I) shelf this idea for now? (or even toss it in the trash can?)

Slowly,
333


Saturday, July 6, 2013

Woody's Raise

We decided to get Netflix recently and I was excited to see that Cheers episodes are available. I occasionally put an episode on in the background while I get work done. I came across this episode that literally snuck in some math (money, raises, time, rate) right before the end of the episode. Sam Malone, the owner of the bar in the tie (played by Ted Danson), is talking with Woody Boyd, a bartender (played by Woody Harrelson), about a raise. Roll Act 1:


After consulting with my man, Nathan Kraft, I bleeped out a part of Woody's last line. The two of us discussed the tendency a bleep can have in implying some profanity was removed. So if this lesson goes horribly wrong, blame Nathan! All those toothpicks finally caught up with him. Here's how the exchange goes between Sam and Woody:
Sam: We were talking about your 50 dollar a month raise.
Woody: Sam, it was a hundred a month.
Sam is caught for trying to pull a fast one on Woody. Woody appears to let it slide, but something occurred to Woody. He turns to Sam and the exchange continues:
Woody: I think a hundred a month is too steep. I'll settle for [BLEEP] a week. 
Sam (without blinking): You got it!
I anticipate students noticing that the amount was bleeped out and wondering what was bleeped. I anticipate students not sure if Woody said, "[BLEEP] a week" or something inaudible? I anticipate students noticing that the studio crowd laughs while wondering if Sam was just made a fool by Woody. I would love to first have a leisurely conversation with students about who they think just got the better deal in this exchange, Sam or Woody? Or was there even a better deal to be had? If you've ever watched an episode of Cheers, you know that neither character has a strong IQ. If anything, Woody is portrayed as a real naive, gullible, and takes-you-at-face-value type of character. Sam is about a handful of points above Woody. So what about Act 2 after you take some guesses from the class on who just got the better deal from this exchange?

This might be the first 3 Act lesson in which I don't have any additional information for Act 2. In all fairness, this might not fit my previous rant on measurable acts, but I think the 8 Standards for Mathematical Practice are rubbing off on me (in a good way), especially Practice 4: Model with Mathematics.

I posted the Woody's Raise lesson on 101qs.com with very little in Act 2 because I'd love to know where the teacher would take this with his/her class. This type of teacher discretion can't be packaged in an online portal or catalog of video instruction. Here's what I threw out there for Act 2 (the first edition):

At what "raise" amount per week would Woody "settle" for the:
  1. Better deal
  2. Equivalent deal
  3. Worse deal
I have many questions when thinking about Act 2. Here's a few:
Over time, when does Sam or Woody begin to benefit or suffer from this deal, compared to the $100 raise per month?
Do all months have exactly four weeks? Does that matter or should we use 52 weeks in a year?
How would you anticipate students representing Woody's better deal versus the worse deal?
What would this look like graphically?
What would this look like organized in a table?
What equations could you anticipate students writing? If any?
How does this deal apply to Woody's hourly rate?
In what classroom could you talk about the tips Woody might make? Remember this takes place in a bar. Middle school students? High school students? College? A workshop with teachers? I think there's a lot of fun to be had with this video clip. Let's Roll Act 3 and see what Woody would "settle" for instead of the $100 a month raise:


I'm posting this lesson because I'm thinking out loud. More importantly, I'm curious what you would do in between Act 1 and Act 3 with your students. How would it be different in an elementary classroom? Middle school classroom? High school classroom? Teacher workshop? What would your Act 2 be? Where would you take this lesson with your students? I believe this is a multi-dimensional lesson that can take on some great mathematics. Bleeping out that weekly rate in Act 1 really opens up Act 2 for some rich mathematical discussions and modeling. Toss your Act 2 in the comments. Thanks!

Cheers,
1026

Monday, July 1, 2013

Back to School Ignite Talk

Man, I love a good Ignite talk.
5 minutes.  15 seconds per slide.  20 slides.
Concise.  Succinct.  Compelling.

Why not do my own version of an Ignite talk at Back to School Night next year? I get 10 minutes with parents and would love to change it up a little this coming year. Trust me, after surviving last year, I think the parents deserve a better, improved, and more reassuring version of Mr. Stadel. I'll explain that last sentence in some upcoming blog posts that I'll use to debrief about the 2012-2013 school year. If you're not sure what an Ignite talk is, let me introduce you to my man, Steve Leinwand.


If you like that, check out more Ignite talks by Annie Fetter, Dan Meyer, Max Ray, and Phil Daro. These are my go-to talks when I need a math pick-me-up. Do the math, that will be a little over 20 minutes well spent, being inspired by some key people in our math community. Seriously, check out those four talks.

I'm brainstorming in this space, so feel free to share some input please. At Back to School Night, I'll start by giving a brief 30-60 second introduction of what an Ignite talk is and how they work. I'll give an Ignite talk for 5 minutes, covering any of the following things:
This leaves approximately 4 minutes for parents to ask questions or something else... Have any suggestions for those last 240 seconds?

Who's with me? Does anyone else want to do a Back to School Ignite talk? There's already been some interest generated on Twitter and I started a Back to School Ignite list. Shout at me if you're in. Or is this a really foolish idea? Seth Leavitt, my new online colleague and EnCoMPASS Fellow asked if I'll post it online. I don't see why not. Maybe we can create a space for Back to School Ignite talks.

*UPDATE: Each item listed above does not correspond to its own slide. I simply listed ideas that could possibly work their way into the presentation. Some support each other. For example, when talking about the importance of problem solving, I would mention resources such as 3 Act lessons and The Math Forum's PoWs. Feel free to add to or subtract from the list.

Ignite,
930

Thursday, April 18, 2013

More Tangrams Please!

This week in Geometry, we did the 3 Act lesson Hedge Trimmer. I'll debrief about that another time. Students needed to find the area of some isosceles trapezoids along the way and I didn't give them access to the area formula for trapezoids. Instead they needed to be resourceful and figure it out on their own. Well, that didn't go too well at first [cue the whining]. Many students had trouble breaking the trapezoid into 3 polygons: a rectangle and two triangles. Their warm-up the next day was to play around with tangrams for the first 5-10 minutes of class.
Me: Use all seven pieces to make any one of the following polygons. Do your best!
I drew a square, rectangle, trapezoid, parallelogram, triangle, and circle. I'm just kidding about the circle. However, I should have drawn one. That's funny. My 8th grade students were terrible at this. I use "terrible" with all the love in the world, knowing this is a learning experience for them.
Me: Have you guys ever messed around with tangrams?
Class: No!
Me: WHAT!!!! Are you guys serious? No one has ever let you mess around with tangrams before? Well, I'm glad we're doing it now. You guys need this. Seriously? You guys have never messed around with tangrams.
Class: Nope.
Me: Okay, well keep trying. [as I began scraping my jaw off the floor]
My request to you all: MORE TANGRAMS PLEASE!

Especially elementary teachers, more tangrams please. Have your students mess around with them. Sure you can download some app onto your tablet or find a web-based site to simulate tangrams, but please do your best to get actual tangrams into the hands of your students. Math formulas come and go for math students. However, if they can visually break apart polygons into more recognizable polygons such as rectangles and triangles, I believe their mathematical proficiency greatly increases. My goal is to get these 8th graders to play around with Tangrams once a week for the rest of the year. At least one of my students was eventually able to put together a trapezoid (top left), which quickly turned into a parallelogram, which quickly turned into a rectangle.
Me: How'd those other shapes come so quickly?
Sean: I just moved this one larger triangle to different spots.
I took a picture of his first configuration so I could share it with the class. I figured I'd give the class a chance to redeem themselves and copy his rectangle configuration.
More tangrams please! 
Repeat after me:


Thanks for listening.

Tangrams,
1104


BTW: Cheat sheet for displaying student work immediately:

  1. Sign up for Dropbox.
  2. Have the Dropbox app on your phone.
  3. Take picture(s) of student work.
  4. Allow the app to upload your camera photos.
  5. Sync your computer with Dropbox.
  6. The pictures arrive on your computer in seconds.

Wablammo!